Unveiling The Secrets: A Comprehensive Analysis of Security Headers Historic Scan Data
In the world of cyber security, knowledge is power, and Security Headers has been a trusted ally for web developers around the world for years. For the first time ever, thanks to the support of our partnership with Probely, we’re going to delve into the treasure trove of historic scan data and explore the insights it can provide! This is something that I’ve wanted to do for a really long time, but I’ve simply not had the time or resources to dedicate to it. Now I do!
The Scan Data
Security Headers stores very limited scan data when conducting scans, by design, but of course we have the basics to populate things like the Grand Totals table on the homepage, along with the Recent Scans, Hall of Fame, and the Hall of Shame.
I want to be clear from the outset that scan data does not include any information about the client initiating the scan, and I mean literally nothing. Here’s an example of a full scan record for a scan that I carried out on my own site just now:
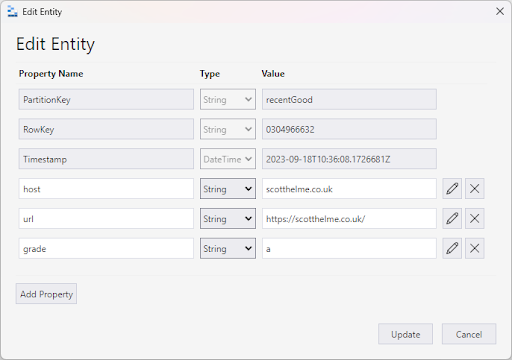
As you can see, it’s very limited, but it’s all we need to do the task at hand, so it’s all we store, data minimisation by design! It’s also worth pointing out that this was stored because I didn’t check the “Hide results” checkbox when conducting the scan.

If the “Hide results” checkbox is checked, we don’t store any record of the individual scan and all we’ll do is increment our global counters for the Grand Totals table. That table isn’t populated by counting the scan records for this exact reason, and instead we maintain our own count. Also, for those familiar with Azure Table Storage, you’ll know that there isn’t an efficient way to count entities in a table, so this was also our only viable option. Other than that, we have some protection against repeated scans of the same target in quick succession, so you may see cached results for a short period, but that’s just a sensible protection to have in place!
The Analysis
Given the sheer quantity of scan data we have, having just passed through 250,000,000 completed scans, Probely engaged a Data Scientist to work on the scan data and provide some insights based on our requirements. Working on the data proved quite interesting and as you often find when working with data at a large scale, interesting patterns and trends will emerge that take some investigation to explain!
We’ll start off with some of the obvious questions that we wanted answering from the data and gradually follow some of the investigations that were spun off as a result of observations that we made along the way.
Frequency of Scans
This first set of data points was one of the most requested amongst the team and people contributed some really interesting variations of the general question of scan frequency. As we have so much scan data, plotting the scans per day was a little impractical, so we took a look at the scan frequency per month since the launch of Security Headers back in 2015!
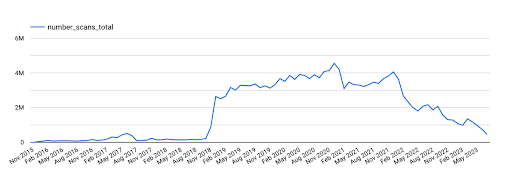
As you can see, for the first few years, Security Headers was making good progress, with a little bump in traffic here and there, but generally the growth was quite low and steady. Then, in 2018, a little less than three years after it launched, that changed!
Because I wasn’t monitoring our popularity back then, I didn’t really notice this huge increase, I was focused on providing a useful tool that worked and I was happy that we were achieving that. Looking back now, it could have been our move from our securityheaders.io domain to securityheaders.com, it could have been the blog post about a bot aggressively scanning the headers of porn sites, or, aligning perfectly with the spike, it could have been the addition of a brand new Security Header called Clear Site Data. Either way, things really took off from here and the growth was impressive.
One thing that did surprise me was the tail towards the end of that graph. I’ve always felt like Security Headers has at least maintained its position in terms of popularity and use, and that it’s never declined, certainly not to that extent. Outside of the individual scan records, the only other data we have is the running the counts of scans for each grade, but I don’t have those available historically, only the current value as it stands right now. I managed to work around that issue though as the Security Headers social media accounts often post about milestones in scan volume so I was able to gather some historic data to plot from that.
| Date | Total scan count |
|---|---|
| 28/07/2023 | 250946930 |
| 18/07/2023 | 249967478 |
| 10/07/2021 | 150155819 |
| 05/11/2020 | 110935491 |
| 04/09/2020 | 100187684 |
| 23/01/2020 | 63362597 |
| 21/06/2019 | 38032607 |
| 15/03/2019 | 27057605 |
| 25/01/2019 | 22017881 |
| 20/12/2018 | 19017275 |
| 29/10/2018 | 15007934 |
| 11/09/2018 | 14011362 |
| 20/07/2018 | 13038272 |
| 15/02/2018 | 10012492 |
| 02/08/2017 | 7018759 |
| 24/06/2017 | 6013950 |
| 10/04/2017 | 4025463 |
| 05/02/2017 | 2923387 |
| 08/07/2016 | 1001325 |
| 31/12/2015 | 50035 |
With this data collected and plotted, it gave me the following graph.
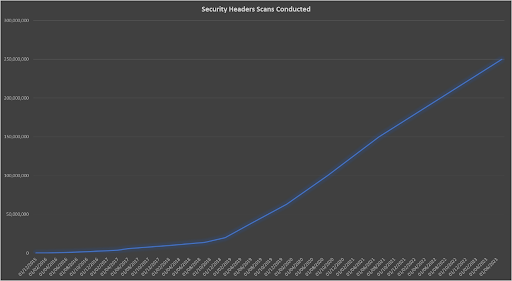
That aligns perfectly with the scan data for the huge spike from 2018 onwards, but doesn’t show the same decline in 2021/2022. Based on the earlier explanation of hidden scans not being stored in the scan data, and only added to the total counts, this makes perfect sense and explains how we can see an increase in counts that isn’t shown in the scan data. Alongside a higher use of the hidden scan feature, scans conducted via the API are also hidden by default but still counted, so this will further contribute to the discrepancy. Overall, that’s a really nice graph to see the growth in scans!
Distinct Hosts
Another trend that was awesome to see was when we looked at the number of distinct hosts being scanned over time. As the number of scans has increased, the number of distinct hosts has also increased, but at a higher pace than might be expected.
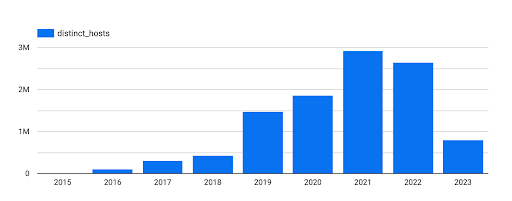
The raw data that we were working with was extracted and sent for analysis much earlier in 2023, explaining the low figures for the current year, but it is encouraging to see just how widely used Security Headers now is!
No Work at the Weekend
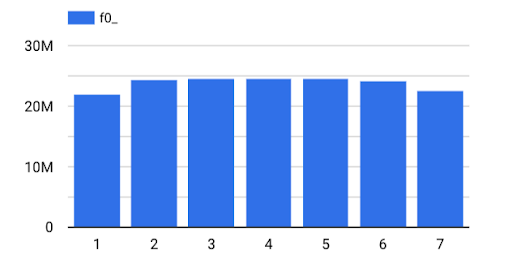
By popular request, we also took a look at what day of the week was typically our busiest day for scans and whether we saw more activity during the week or during the weekend. The data is pretty clear on this one!
With Sunday being day ‘1’, it’s clear that we’re seeing more traffic during the weekdays than the weekend, but it wasn’t by as much of a margin as I thought. Automated traffic performing scans via the API is possibly not affected by the day of the week, but much of our traffic comes directly through the website conducted by real people, so I guess we’re a little more interested in security during the working week!
With Sunday being day ‘1’, it’s clear that we’re seeing more traffic during the weekdays than the weekend, but it wasn’t by as much of a margin as I thought. Automated traffic performing scans via the API is possibly not affected by the day of the week, but much of our traffic comes directly through the website conducted by real people, so I guess we’re a little more interested in security during the working week!
Seasonal Changes
Along a similar line of investigation, we also took a look at whether there were big shifts in the number of scans conducted from one month to the next, and the data showed that there was.
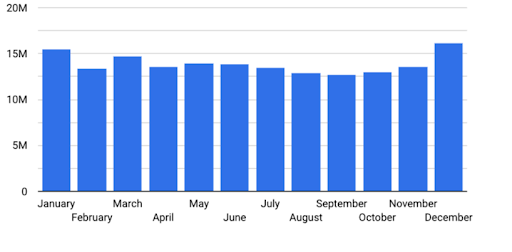
Hitting the lowest point in September each year, and the highest point in December, this was definitely not what I was expecting! I had no real basis for my theories, but I think it’s fair to say that everyone had their own guesses on how these graphs would turn out, and my guess here was wrong! If you have a theory that might explain this trend, drop us a comment on social media and I’ll take a look, I’d love to hear what people think.
Grade Evolution
Okay, okay, I’ll get to the good stuff! Many people were interested in this particular trend and I think it’s fair to say that we can boil this down to the underlying question: “Are we getting better or worse at security?”
Now, I have to remind you that over time our grading criteria has changed as new security headers were added and old ones removed, but here it is!
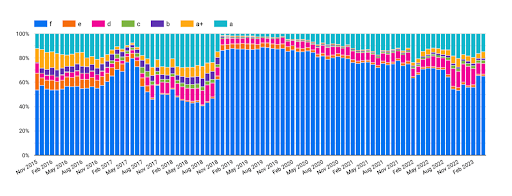
That big hit for the spike in F grades in Nov 2018 aligns with our sudden surge in popularity back then and I can only explain this with the assumption that new sites being scanned for the first time are likely to have a lower grade overall. There were some grading changes in 2018 also, but they don’t quite align with the graph, so I don’t think it explains the shift. What we do see though is that the percentage of F grades is gradually reducing over time so we can say that as time goes by, we are getting better at using Security Headers, but we wanted to go a little deeper.
Of the 45,980,412 URLs that were scanned more than once, there were 45,509,000 that did not change their score across scans. Of those URLs, there were 43,849,895 URLs held firm with an F grade, another 609,404 URLS that stuck with an A grade and only 57,162 URLs that maintained an A+ grade.
Of the 45,980,412 URLs that were scanned more than once, there were 471,353 that did change their score across scans. Of those URLS, we managed to get 350,840 to improve their grade and 120,000 had their grade decline. Of those that improved, there were 14,161 that managed to make the jump from an F grade all the way up to an A+ grade and 135,662 managed to improve their grade by at least two ranks. Nice work!
Most Common Suffix
I think it was always obvious that .com was going to be the most popular suffix, but there were some surprises in the rankings. Where does your own ccTLD rank in terms of frequency? Here’s the Top 20.
| suffix | scan count |
|---|---|
| com | 87,007,459 |
| net | 12,124,378 |
| org | 8,495,458 |
| ru | 7,120,181 |
| de | 3,126,062 |
| info | 2,838,109 |
| se | 2,443,967 |
| biz | 2,152,591 |
| fr | 1,803,860 |
| jp | 1,646,055 |
| it | 1,451,008 |
| nl | 1,429,353 |
| us | 1,265,043 |
| uk | 1,254,177 |
| kr | 1,099,870 |
| co | 801,059 |
| br | 738,122 |
| eu | 721,812 |
| be | 716,408 |
| in | 697,732 |
If you’d like to see the entire list for suffixes scanned, you can access the raw data that the Top 20 was taken from right here.
We’ve published the entire summary of scans per suffix over on GitHub so if you want to dig a little deeper in the data, you’re more than welcome to.
Average Grade by Suffix
Whilst it was inevitable that .com was going to be the most popular suffix based on scan volume, I wanted to know who was going to be the best suffix based on grade. It’s time to pitch suffixes against each other and see who comes out on top! To make this a little easier, grades were converted to numerical values using the following transformation.
CASE
WHEN grade = 'f' THEN 0
WHEN grade = 'e' THEN 2
WHEN grade = 'd' THEN 4
WHEN grade = 'c' THEN 6
WHEN grade = 'b' THEN 8
WHEN grade = 'a' THEN 9
WHEN grade = 'a+' THEN 10
END
With this done, it’s now a little easier to average out the grades for a particular suffix, giving us the following results for the Top 20.
| suffix | average score |
|---|---|
| cm | 9.790027806 |
| pro | 7.870634986 |
| dk | 6.242127508 |
| ph | 4.86024526 |
| nl | 3.728077467 |
| id | 3.359777476 |
| au | 3.238277341 |
| eu | 3.093179574 |
| ca | 3.033813901 |
| win | 2.96154198 |
| com | 2.893179215 |
| tw | 2.886337816 |
| de | 2.880175126 |
| xn–p1ai | 2.830322966 |
| br | 2.724854908 |
| me | 2.678325284 |
| edu | 2.563739043 |
| uk | 2.561184947 |
| es | 2.555499346 |
| org | 2.447345618 |
If you’d like to see the entire list for the average score based on suffix to check where your country ranks, you can grab the whole list right here.
One of the big standout winners here has to be the .nl suffix. They ranked 11th in terms of most popular suffix to be scanned and then 5th in terms of the highest average score! They also have a particularly high volume of scans compared to the rest of top 10 so this isn’t just a bit of luck with a small number of domains, this is a really good result. It’s surprising (or not?) to see the .com suffix drop so far down in 11th place and there are also some other TLDs that I wouldn’t have expected to see so high up in the rankings. I do wish that .uk domains had done a little better than 18th… Where did your country rank in the list?
Per-site Analysis
During this research, we did do some quite detailed analysis on a per-site basis. This involved looking at scans across all pages on the same site and comparing them to see if a grade on the homepage was representative of the grade across the rest of the site. The good news is that there is a really high probability that the grade on the homepage is likely the same as the rest of the site! Well, it’s good news if you’re getting an A+ on your homepage, but not so good if you’re getting an F…
I didn’t want to share too much of the raw data in this regard because it is, of course, very site specific and it goes beyond what is available via the Security Headers site. If you’re interested in how you’re doing across your site or sites, maybe take a look at the Security Headers API Key and you can start scanning in minutes!
Do you have any ideas?
What other cool analysis could we do on this data? Maybe there’s something you’ve thought of, but you’ve not seen it here, and we’d love to hear from you! Feel free to reach out across our social media channels and let us know.
Unlock the power of proactive web security and gain a competitive edge, sign up for a free trial with Probely today!